Tips on how to use our software
Learn the different features of the SPM assets software to become the best asset manager you can be. Use the software tips and tricks below to get the most out of the software SPM Assets offers.
Better analysis through Property Hierarchies
If you are managing large complex buildings, i.e. office blocks, multi-unit complexes, community centres, etc., structuring your assets into a Property Hierarchy will help you better understand these sites.
A Property Hierarchy organises your large assets by breaking them down into a tree structure. For example, a large commercial site would be configured as a single site with multiple buildings, each building having multiple floors made up of multiple units. This means you can easily report across your site, buildings, floors or units, and drill down to discover key insights.
When and why to use
- We often set up the hierarchies for surveyors so they can use component or property templates to quickly populate component data in the field.
- For quick reporting and analysis on components, you can set up your hierarchies and add components at the appropriate level. The Ground/Block/Unit hierarchy is common for commercial and residential units where external sundries are allocated to the Ground, exterior fabric and finishes to the Block, and Internal finishes to the Unit.
- For smaller buildings and housing providers, it is sometimes best to add all components with locations to the property records. Practically, this is not a hierarchy, but hierarchies work best for large assets.
If you feel you would benefit from structuring your large assets into a hierarchy you can set these up in a number of ways: -
- By selecting Hierarchy and Type from the Property level edit screen
- By using the DataFlow to import the hierarchy model.
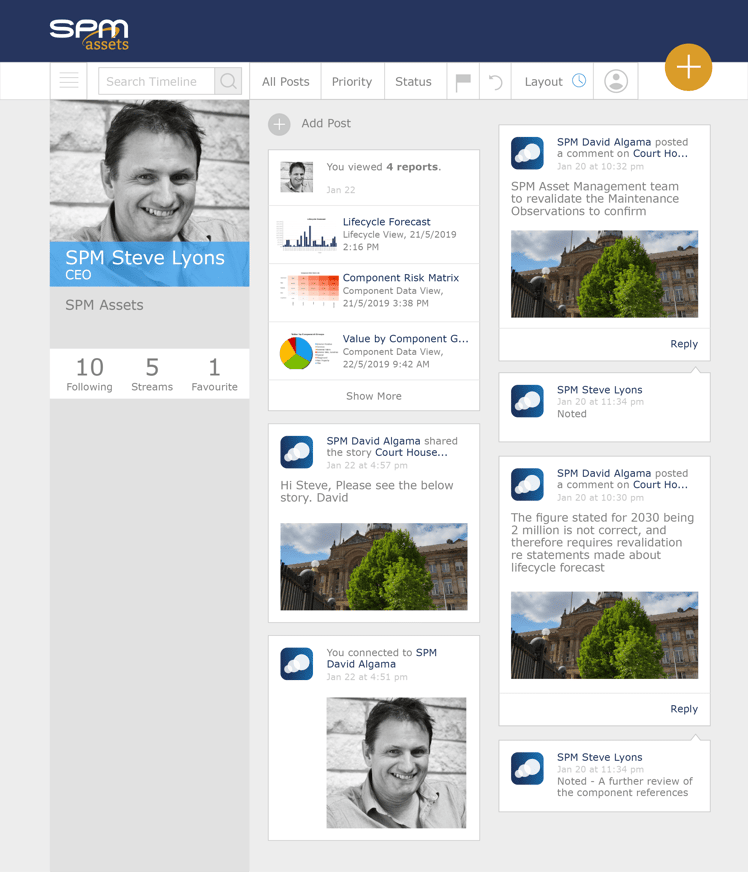
See your timeline in Stories
The timeline in Stories is designed to allow users to view activities related to them and track the latest updates. The feed displays a wide variety of events, depending on a user's settings. While on your timeline you will be able to:
- View events relating to a user and content
- Open content referred to in events
- Post comments and update
- View comment threads
- Respond to comment threads
Get up-to-date with the latest activity on your Stories at a glance, and click on the content thumbnail to open in more detail when required. The timeline also allows users to post comments or updates on another user's timeline, much like you would post in a discussion group.
Think of Stories as your asset management hub - where all things asset management are collated.
How to update property data in bulk
As an asset manager, I want to update a selection of properties from my portfolio from owned to leased. How do I do it?
This is a common question that we hear from users. The answer is using the specialised 'Search' function to select your properties and to update them quickly using the 'Dataflow' function.
Follow these simple software tips below:
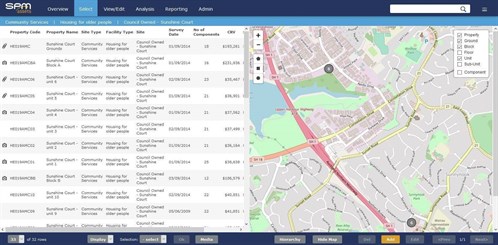
Step 1: Select your properties with a search field containing 'leased'.
.png?width=591&name=image%20(2).png)
Step 2: Create a 'saved selection' of the resulting properties - this enables you to easily come back to this selection at any time for any other function e.g. running a Lifecycle model on the same selection of properties.
.png?width=816&name=image%20(3).png)
Step 3: Use the 'Dataflow' model to export the data to MS Excel so that bulk changes can be made and then re-imported (requires Advanced Data and Administrator access). You will see in the screenshot below that the data model is for 'Lease data'. This allows the bulk change of a range of lease information. The same process can be followed for other data models like; components, property, and maintenance.
.png?width=814&name=image%20(4).png)
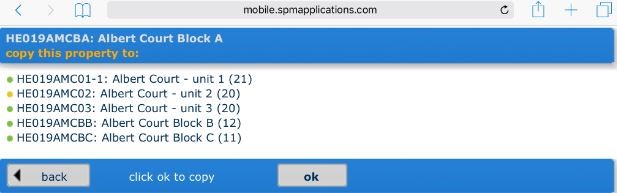
How to save time on surveys using the "Copy" function in Mobile
Here’s an overview of the copy function available in SPM Mobile, that you can use in the field to speed up survey time and boost productivity. This function is used when two or more properties (rooms etc.) are either exactly identical or very similar. For example, when doing an office building or admin centre that has many small similar offices, you would survey the first one as per normal and then follow through as below. When you implement this on rooms that are almost or exactly the same, a survey can be done in less than three minutes, and rooms that are similar can be done much faster than having to load all the data from scratch.
Important: The components, quantities, condition grades and component comments are copied. So if you have made a comment in against a component you may need to remove it. Photos and defects and defect comments are not copied.
- First of all, make sure you have selected both the property that has been surveyed (which has data in it) and the unsurveyed property (without data) where you want the info to go.
- Press the “copy” button at the bottom of the page.
- This then brings up the “copy” page.
- On this page, you can copy the whole room to create a new one as well, but for now, we will look at just copying the data into an already existing room. Press the words “copy this property to” in the top left corner.
- This will bring up the screen that lets you select where you want to copy the data into. Remember that you need to have already selected the property and it must be in your active properties list.
- Tap on the property to which you want to send the data. In this example, it’s TRN01-L1-1.17: Training 1-L1-Room 17 (null).
- This then brings you back to the “copy” page but there is a difference: it has changed the fields to show where the data is going. As below, you can see that the data of TRN01-L1-1.12: Training 1-L1-Room 12 is going to be copied to TRN01-L1-1.17: Training 1-L1-Room 17.
- Select what you want to copy across, in this case, the components. Then press “ok”.
- A warning message to remind you that the copied data will overwrite any data that previously there will appear. Press “OK”.
- If you click into the property that the data was sent to, in this case, TRN01-L1-1.17, you will see the new data in blue, showing that it is unsaved and only exists on the device and not on the server, so confirm it is the correct data and then press “save”.
- After the “save” wheel has stopped, click back into the property and confirm the data is now in black, then confirm the data matches the room you are surveying.
Projects showing in Lifecycle
To further help you plan your annual and short-term budgets, the Lifecycle graph now includes Projects – see the yellow in the screen image below. The graphs in both the Lifecycle Analysis function and the Portfolio Dashboard have been updated to show these Projects. The Project value is the entered project cost rather than the component GRC – this means that a high-level project scoping cost will be shown. For example, a project could have an estimated cost of $100,000 with only $40,000 of components assigned – the yellow bar would show the $100,000 and the $40,000 of components would be removed from the Opex/Capex GRC values.
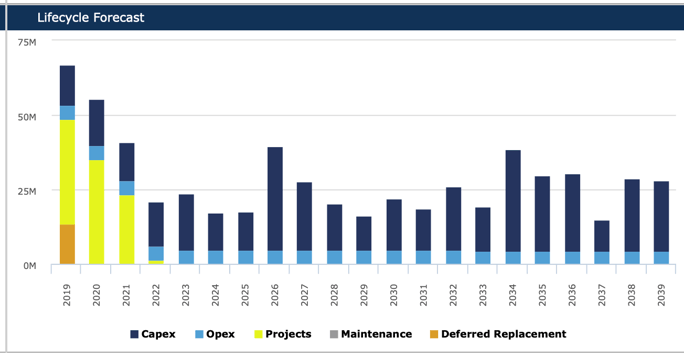
As an Asset Manager, you usually make recommendations and decisions at a project level – this new graph will help you communicate the differences between component-level lifecycle analysis and project-level decision-making. For the graph above, you would aim to minimise the Opex/Capex and Deferred Replacement values by assigning components to planned projects. You may only plan your projects out over a 3 to 5-year period – keeping in mind that the total project budget is aggregated to the first year. Components will then cycle from the year of the Project, e.g. the $40,000 of components in a 2019 project with a 10-year base life, which will show in the lifecycle analysis again in the year 2029.
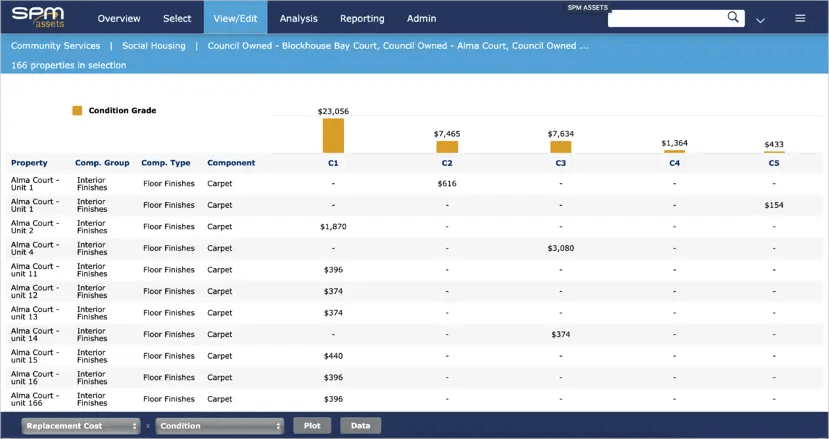
Component Workspace
Component or asset data can be viewed, interrogated and updated using the Component Workspace function. The Component Workspace can be used to view and update components associated with a single property through to many properties. It looks and acts like an MS Excel spreadsheet. SPM users can find, report and extract data to an MS Excel CSV file. It is also useful for summarising information over a group of property records or a reporting category.
The Component Workspace has two handy features that can be forgotten when using this tool.
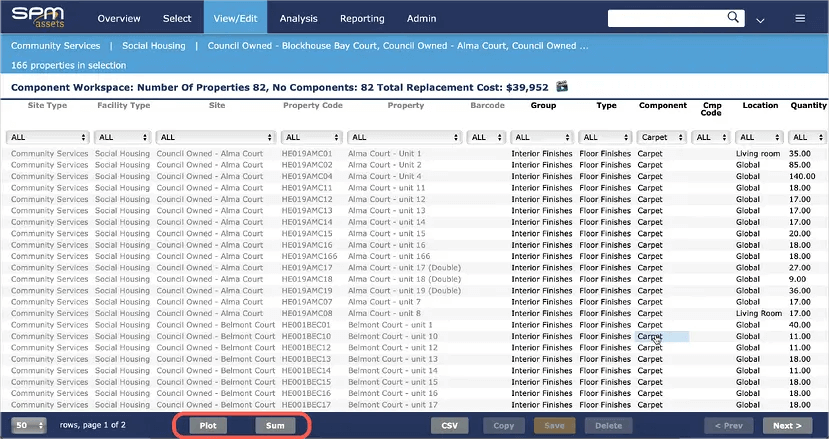
1. SUM button: produces a summary of component quantities and measures for your specific filter set.
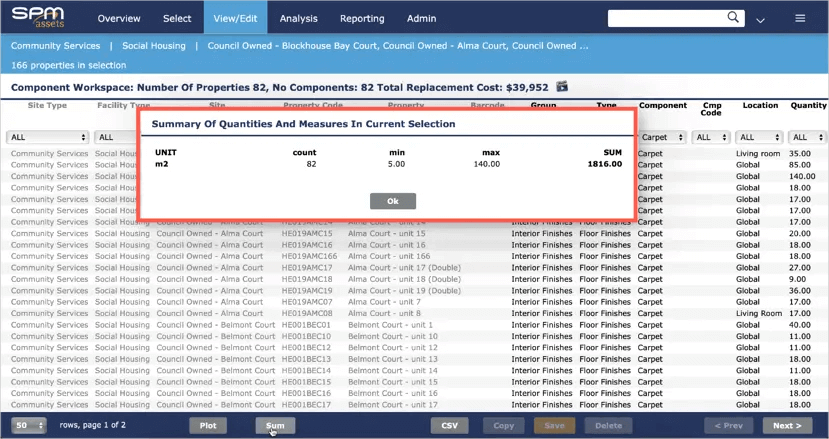
2. PLOT button: displays a graphical analysis of your specific filter set.
360 degree photographs can now be viewed within SPM Assets

A popular usage of the SPM Assets product is to collect Documents and Photos related to the administered Assets. A picture has the ability to display more than words can describe and using 360° photography, one photograph can take over the task of many pictures.
A 360° photograph is recognised by its dimension and image tags. In the Document and Photos form the photograph will be displayed in its normal "flat" dimension which will look a bit strange. A new icon will indicate a 360° capable photograph and a click on that icon opens a special viewer, displaying the photograph, as intended.
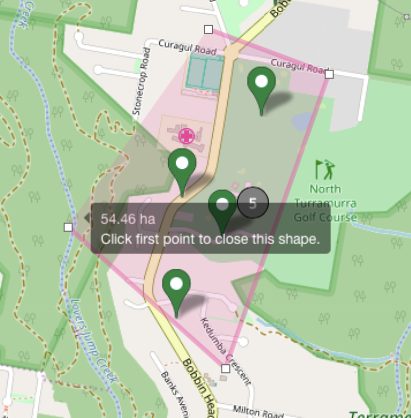
Portfolio Mapping
There are a couple of new Portfolio Mapping features now available:
- Use the Shape Selector to measure an area – a quick way to determine the land area of a specific site.
- It’s now easier to select a grouping of assets on the map and transfer these to the Survey Planner function for further filtering and allocating to inspectors' schedules.
Keep in mind that the Shape Selector function filters out that specific group of assets for further interrogation in other functions such as workspace, lifecycle and project planning.

Linking with SPM Assets – Third Party APIs
Since 2014 our ‘vision beyond software’ has included connecting ‘best of breed’ software and exchanging data to deliver compelling outcomes for Asset Managers. These APIs are a vital part of working towards this vision and we believe they will provide many of you with significant value. Also see Steve’s presentation at the Conferences that talks about ‘one ecosystem of applications that does everything’.
The current APIs allow third-party applications to create and update both property and component level information. Supporting documentation also exists to assist with implementation. The APIs will be extended further over time to cover other areas of the product such as Property Quality Standard and Component Details information.
As an example, you could use the APIs to synchronise component level data between your corporate ERP and SPM Assets – as your infield people maintain the component data with the SPM’s Mobile application, the resulting data would be automatically sync’d to the ERP.
If you are interested in purchasing the APIs or learning more about how they could be useful for you, please contact your Account Manager.
Summary Asset Management Plan
The Summary Asset Management Plan (Summary AMP) report is an updated version of the Summary report which provides an overview report for a property and the spaces linked to it via the hierarchy.
The new features include:
- New easy to read format
- Additional information on the front page
- Description comment includes a Value of Component Groups graph
- New Level of Service comment field and graph
- Removal of the Appraisal comment on the front page
- Level of Service section includes both pass and fail status for each question
- New Glossary section
If you would like to change to the new formatted report please advise your account manager.
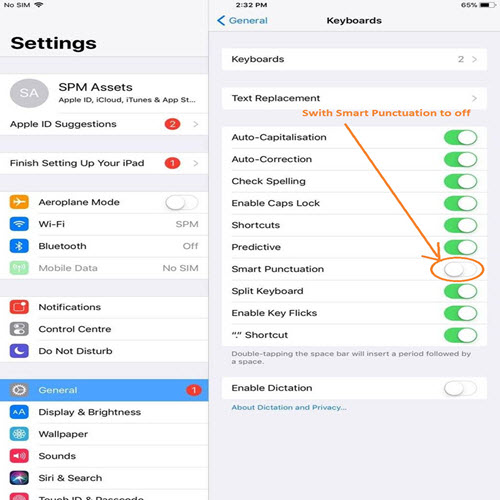
Funny Characters Appearing in your CSV Downloads?
We have found that the conversion to csv is not reading the new curly apostrophe which Apple introduced.

If an apostrophe is added by dataflow or on the desktop it will use the straight apostrophes and display as expected. Without changing the keyboard settings on the iPad, it will display special characters in the csv downloads - don’t
To stop this occurring, change the keyboard setting, in the iPad, for Smart Punctuation so it is disabled (as shown below).
Apple releases IOS12
Apple have released iOS12 for iPads to make your “experience even faster, more responsive and more delightful.”
We have completed testing and the release has not affected any of the functionality available is on SPM Mobile.
The following iPad models support iOS12
- 12.9-inch iPad Pro 2nd generation
- 12.9-inch iPad Pro 1st generation
- 10.5-inch iPad Pro
- 9.7-inch iPad Pro
- 9.7-inch iPad 6th generation (2018)
- iPad 5th generation (2017)
- iPad Air 2
- iPad Air
- iPad mini 4
- iPad mini 3
- iPad mini 2
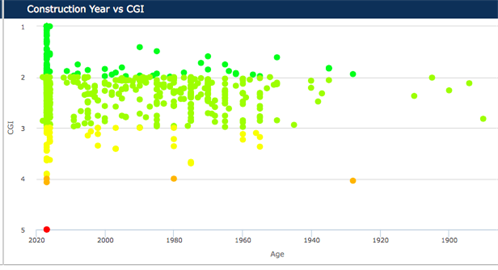
Interrogating Outliers – Age Vs. GRC Vs. CGI
We recently introduced a new analytical model that highlighted outliers when comparing the age, condition and value of properties. From May, rather than adding a new website item, can you simply add this new screen image to the previous website article and extend the article with: “From May, you also have access to a new advanced reporting function to interrogate the resulting data using the Self Service Reporting (SSR) function".
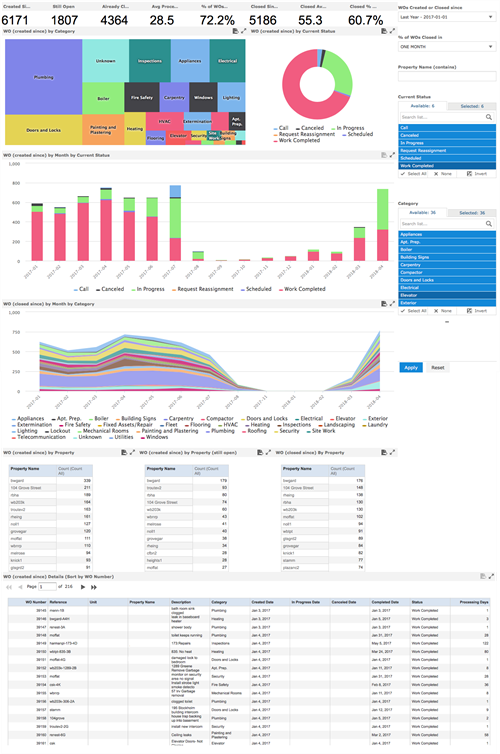
Assets Intelligence – Work Order Dashboard
This dashboard presents work order data in various ways and enables users to identify interesting insights from the data. The detailed table shows users the work orders they are interested in whilst being easy to use and interpret in different ways.

Next Generation User Interface
After a significant amount of work, it was with great pleasure that we unveiled the next major version of the SPM Assets product at our Auckland and Sydney conferences in March. The updated version was released in beta form at these events and is now available for you to use. We think it is a great step forward to improve the overall user experience of SPM Assets.
You may have noticed the image on the login screen promoting the new version. Click on the image and login the same way. We are always interested in your feedback so if you have any comments to share please let your Account Manager know.
We are currently applying some finishing touches to the new version. Once these are complete and thoroughly tested, the current version will be retired.
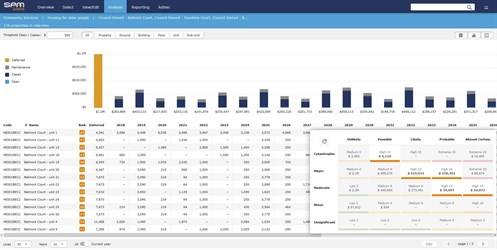
Interactive Risk Matrix
We have added a further functionality to the Risk Matrix which allows users to select and filter data on the risk matrix, the profile and the table update accordingly.
This now allows you to understand at risk areas within your portfolio by property or component; compare the highest risk rating of multiple properties, consider the timing of replacement of assets from a risk perspective. In addition to this, it will assist to forecast end of life and understand the most important assets that need to be replaced over a specified period. This functionality is part of the Advanced Lifecycle module. Please contact your account manager for further information.
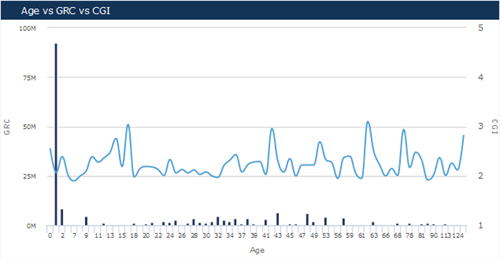
New Dashlet – Age Vs. GRC Vs. CGI
We recently introduced a new analytical model that highlighted outliers when comparing the age, condition and value of properties. From May, rather than adding a new website item, can you simply add this new screen image to the previous website article and extend the article with: “From May, you also have access to a new advanced reporting function to interrogate the resulting data using the Self Service Reporting (SSR) function.”
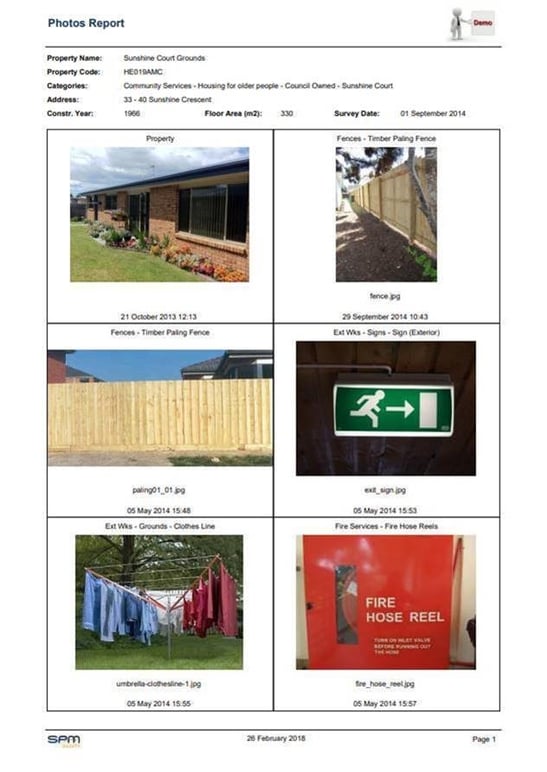
Updated Photo Report
As part of our continual improvement, we have just released an updated Photo Report. This new look report includes a greater level of detail on each photo and is now available to all customers. You will find the report under the Reporting Menu.
Assets Next
We are pleased to introduce the new SPM Assets user interface which we have been working on. This is the first step in some on-going improvements to the user experience. You will find the most immediate difference in the menu structure, which now runs along the top of the form and provides greater screen real estate as a result of the redesign. The user experience has also been improved through more consistent and cleaner styling and colour schemes. All functionality remains the same as part of this redesign so we expect you to find it straight foward to transition from the existing version. This new interface will be unveiled at the User Groups and - if you would like to try it before then please contact your account manager.
Risk Based Planning Enhancements to Self-service reporting
With the recent release of the Risk Based Planning functionality we have two exciting enhancements to Self Service Reporting to announce this month.
Risk within existing Lifecycle Analysis Report
The calculated risk rating score of individual components has been added to the existing Lifecycle Analysis report for those customers who use the Advanced Lifecycle module. This additional information enables you to consider risk of failure when planning future lifecycle expenditure requirements.
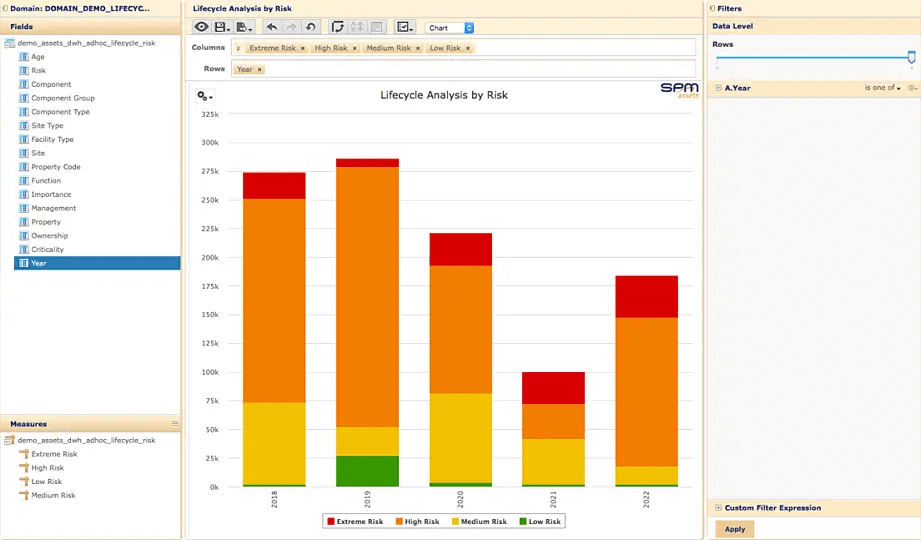
New Lifecycle Analysis by Risk Report
We are excited to release a new report that presents a lifecycle analysis forecast based on risk exposure of individual components. This report was an idea that came from our Auckland Regional User Group in October last year following a demonstration of the new Risk Based Planning functionality.
Overall these enhancements to Self Service Reporting create another dimension to the analysis that can be performed, further empowering asset or facility managers to maintain their portfolios effectively, all based on the Risk Based Planning functionality recently developed within SPM Assets.
Save your selected data set for quick access in the future
All functions within SPM Assets are based on a selection of data that you determine before accessing a specific function. The selection of many data sets is a very simple and quick exercise however much more complex data sets can be selected to view a specific group of properties through various means such as applying search criteria on multiple attributes of your properties. In order to simplify this selection process and save you as much time as possible, you can save a particular data set to access it the click of a button rather than having to repeat the complex selection process. In order to do this, you have to save a specific data set of property records so it can be accessed either by you only or by all users. Then you are able to select this data set again in the future in a couple of simple steps. This two minute video explains how to set up and access a saved data set.
View the helpful tutorial here.
Keeping your data safe
Losing important data and the knowledge this data can provide can be an absolute nightmare. Often a huge amount of time and money has been invested to build that data and resulting knowledge up, usually over extended periods of time. In many cases, that knowledge is relied on for critical business operations.
SPM Assets recognises that catastrophes do happen from time to time and as a result significant focus is placed on keeping your data safe in the event the worst does happen. Specifically, we follow the 3-2-1 approach to data backups which is widely recognised as good practice. At least three separate copies of the data are kept, on at least two different types of media, with at least one copy held at a separate location. This approach is based on achieving a conservative balance between risk of data loss and the cost of data retention.
SPM Assets follows this process by replicating data on a server locally in the cloud for retention of backups over the medium term and a cloud archiving service that stores backup data on a different form of media and in a separate location over the long term.
Component Survey Year
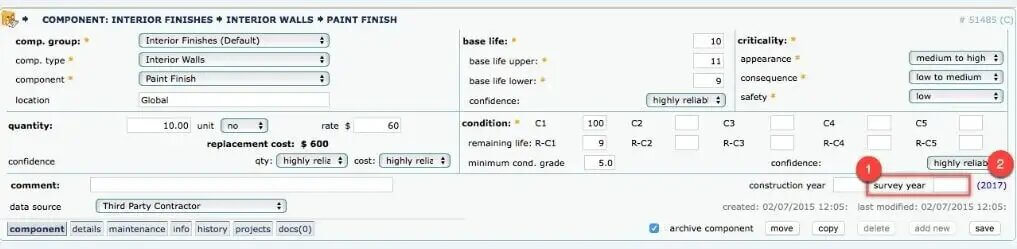
The survey year of a component is the year that the most recent survey was completed and condition values updated for the selected component. This year is shown in figure 2 within the screenshot for any selected component. This is one of the most critical data points as the lifecycle analysis is based on this year when an analysis method that considers assessed condition or remaining life is used. In most cases the component survey year will be the same as the property level survey date or more recent when an individual component is updated without the whole property being surveyed. An example of when it may be more recent could be the result of a resurvey of an air-conditioning unit when it is serviced by a specialist in between periodic surveys of the property. However, occasionally a component survey year maybe older than a property level survey date. This could occur when a property is surveyed but the mechanical plant and equipment components are not included in this survey. If a specific component is surveyed in a different year to the overall property, the year of survey is entered in the field highlighted as figure 1 in the screenshot.
If the survey year field is left blank, the survey date at the property level will be used.
Mobile Data Collection
The Mobile data collection tool has many great features for optimising the data collection process. Due to the extent of handy features available, some aspects that speed up the data collection process are not as obvious as others, particularly to infrequent users of the tool.
One very useful feature, is the ability to copy data collected, such as components, defects, and property quality standards, from a property to another existing property on the user’s device. This feature is ideally suited for surveyors who are surveying multiple dwellings of a similar nature or in the case where the property hierarchy is detailed to a room level, or where large buildings have multiple rooms of a similar nature.
To use this feature simply select a property within the property list screen to highlight the row and select the copy button at the bottom of the screen. That will present a screen that gives you the option to copy your selected property by creating a new property. To avoid creating an additional property and copying the associated information to a new property, simply select the ‘copy this property to:’ text at the top of the screen and select the existing property from the list presented.
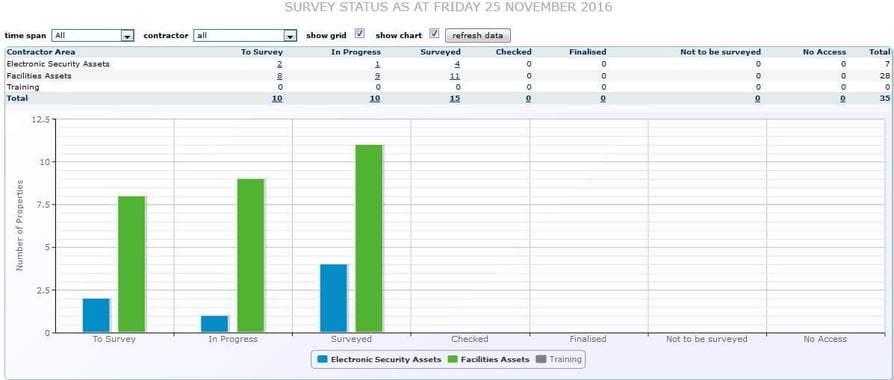
Property Status and Survey Date
The survey date of a property record or an individual component is the line in the sand from which the timing of replacement is forecast using assessed condition and other factors within the SPM Software. The accuracy of this date is critical to ensure lifecycle analysis forecasts produced within SPM Assets are meaningful and can be used as the basis for evidence based planning decisions.
We often find surveyors overlook the need to update this date for every survey they complete so there is a handy feature within SPM Assets that links this date to a change in the Property Status. When a surveyor marks a property as being ‘Surveyed’ the survey date can be automatically set. We find that having a business process as part of a survey project that involves a series of steps including each property being ready for survey, in progress, surveyed, checked, and finalised results in much more accurate survey dates. Those involved with the project are responsible for update the status as each property moves through the survey process which also has the added bonus of being able to monitor the progress of a project using the Survey Dashboard within the software.
Contact your Account Manager to make sure the Survey Date is set to automatically update on status change or for further information on using the status as part of a survey project.
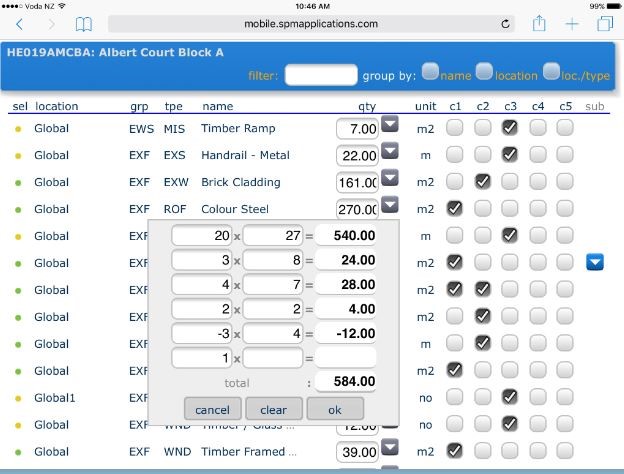
Calculator in Mobile
Within Mobile there is a handy calculator feature for collating the quantities of components that are made up of several parts. Whether it is the area of multiple windows, multiple lengths of downpipes, or convoluted roof areas the component quantity calculator makes it easy to aggregate and capture the quantity of any component.
To use the calculator simple click on the drop-down arrow beside the quantity field of an individual component and enter as many dimensions you require to calculate the overall quantity of a component. More rows will automatically appear if you need them. The left column is pre-populated with values of one for adding multiple lengths in the right column. These can be overwritten for calculating multiple areas using length and width dimensions. You can also enter negative dimensions which is very useful for subtracting the area of window space from a wall cladding or finishes component!
This feature is widely used by SPM Assets’ surveyors including Simon Meadowcroft who had this to share:
"Operating the calculator is so simple, with a quick tap on the drop-down arrow at each individual component you can quickly add or subtract various quantity totals and even do individual multiplications without fumbling around trying to balance a calculator and an iPad at the same time! Thanks for this fantastic function!"
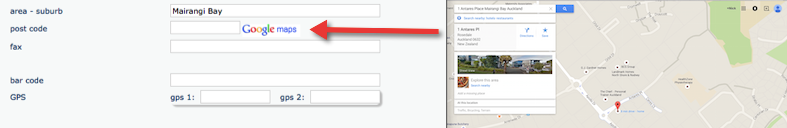
Capturing accurate GPS Coordinates in the field using Mobile
The Mobile module allows users of the SPM Assets software to capture their GPS location when using the application in the field in order to specify the location of records (both properties and components) within their portfolio. The software pulls location information from the device that is determined using inbuilt GPS functionality. This functionality does not always run continuously on various table devices so in order to ensure accurate coordinates are captured in the field we recommend that users launch a map application and check the device’s perceived location is accurate before selecting the Get Position button in Mobile to populate the GPS fields. This can be done by selecting the ‘show location’ option within Apps such as Google Maps or Apple Maps before switching back to Mobile to capture your coordinates.
Repairing defects
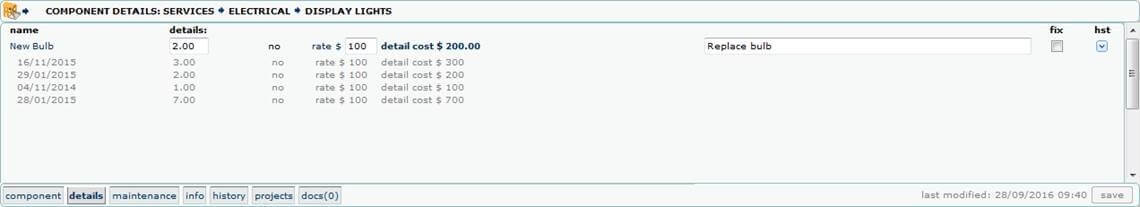
Did you know component-level Defects can be marked as 'fixed' simply by ticking the "fix box"? This is a simple way to confirm that defects have been repaired - you can do this in the field with Mobile or through the Desktop screens to maintain the data throughout the year.
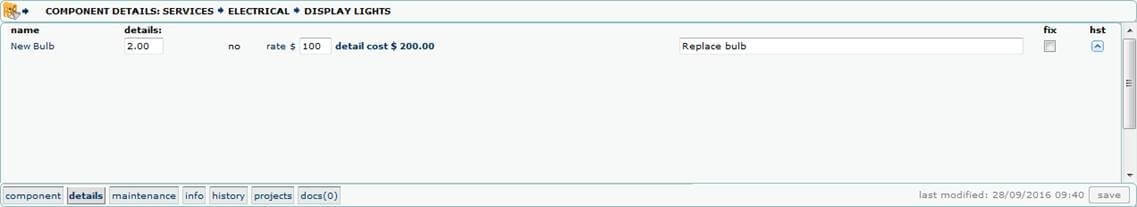
As you can see in the following graphic, the history of 'repaired defects' is stored at a component-level. With this information being maintained, you will be able to report which component types have had the highest number / cost of repairs. It will also allow the 'mean time between failure' style analysis. Ideally, the function should be used for annual inspections to generate the 'repairs work programme'.
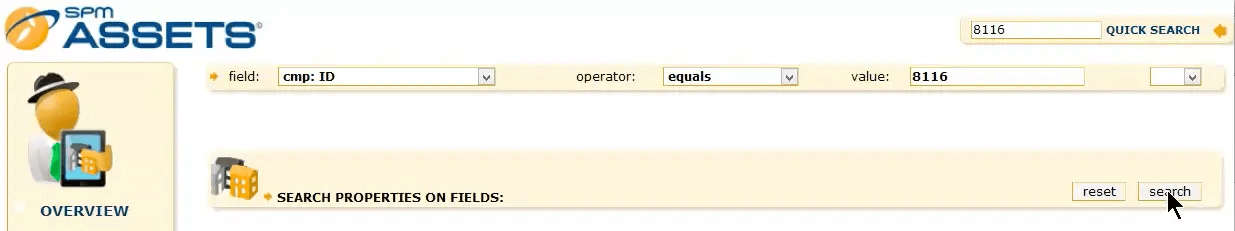
Full Search
Learn how to use the full search tool to select a list of properties based on a search criteria. See how you can search using property-level data and/or component data.
Click here to watch the video tutorial.
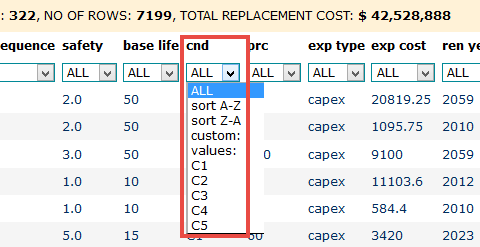
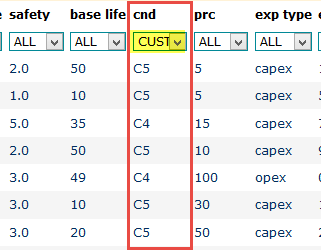
Custom Expressions
Our range of custom filters (custom expressions) allow you to filter on component data when using Project Planning, Survey Planner, Component Workspace or Component Updater. Within these modules, select 'custom' from the drop-down list at the top of any column then enter a custom filter.
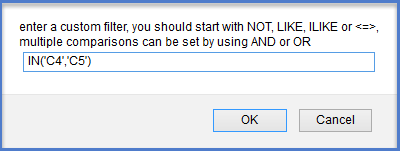
Example
To setup a project that includes those components in poor and very poor condition. use a CUSTOM EXPRESSION under the Condition Column: IN('C4','C5')
Google Maps
Quickly view the location of a property by clicking on the 'Google maps' icon within the address section of the property summary page. A new window will open pinpointing the location on Google Maps.